Will all of the swing states move similarly in the 2024 election (based on std dev of change in margin from 2020)?
➕
Plus
4
Ṁ928
resolved Nov 23
100%13%
1.5-2.0%
9%
<1.0%
14%
1.0-1.5%
27%
2.0-2.5%
18%
2.5-3.0%
18%
>3.0%

For the purposes of this market, the seven swing states are: PA, MI, WI, NV, AZ, GA, NC.

The margin swing measures the change in margin from the previous presidential election.

For comparison, in 2020, the margin swing for these seven states was:

NC: -2.31%

NV: 0.03%

WI: 1.40%

PA: 1.88%

MI: 3.01%

AZ: 3.81%

GA: 5.37%

(Positive numbers represent a shift toward Biden, and negative numbers represent a shift toward Trump.)

The standard deviation of these seven values is 2.4%, so in 2020 this market would have resolved to 2.0-2.5%.

Get
Ṁ1,000
and
S3.00
Sort by:

Michigan: -2.8% -> +1.4% = 4.2% shift

Nevada: -2.4% -> +3.1% = 5.5% shift

Pennsylvania: -1.2% -> +1.7% = 2.9% shift

Wisconsin: -0.6% -> +0.9% = 1.5% shift

Arizona: -0.3% -> +5.5% = 5.8% shift

Georgia: -0.2% -> +2.2% = 2.4% shift

North Carolina: 1.4% -> 3.2% = 2.8% shift

Std dev = 1.501%.

Calculating using 2024 results from Nate Silver:
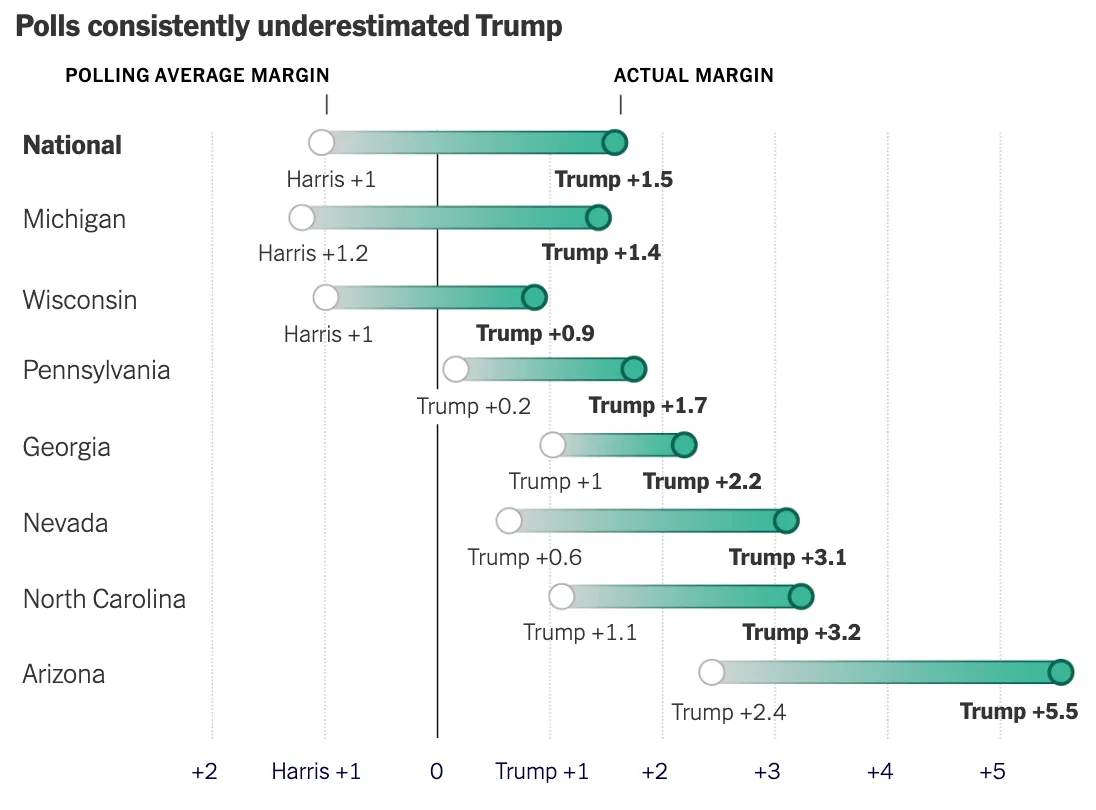
Michigan: -2.8% -> +1.4% = 4.2% shift

Nevada: -2.4% -> +3.1% = 5.5% shift

Pennsylvania: -1.2% -> +1.7% = 2.9% shift

Wisconsin: -0.6% -> +0.9% = 1.5% shift

Arizona: -0.3% -> +5.5% = 5.8% shift

Georgia: -0.2% -> +2.2% = 2.4% shift

North Carolina: 1.4% -> 3.2% = 2.8% shift

Std dev = 1.501%.

Is this question

"What will be the standard deviation of the margin shift towards Biden in the set { PA, MI, WI, NV, AZ, GA, NC }"

?

I mean, is this the question being asked?

@BrunoParga Yeah, do you think that works better as the title?

@TimothyJohnson5c16 something like that probably works better, yes ☺️

© Manifold Markets, Inc.Terms + Mana-only TermsPrivacyRules