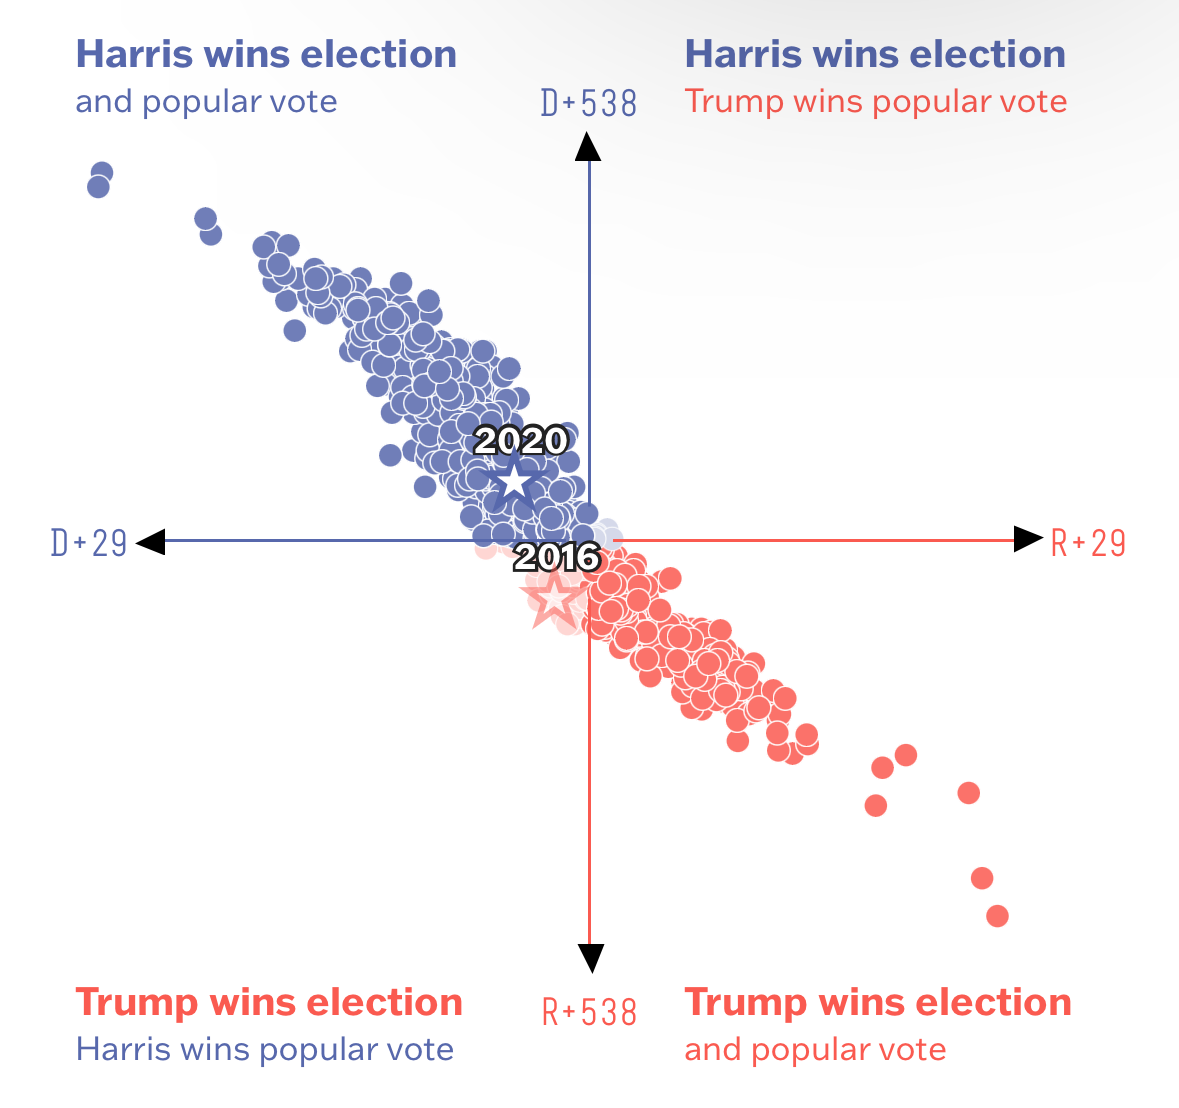
Who will target EC swing states votes better and how much difference compared to popular vote?
Democrat Electoral college % = (Democrat electoral college votes / Total electoral college votes (typically 538)) *100
Total for all states not just tipping point states.
EC looking like 226/538 = 42% for Dems
Popular vote in last 12 days increased from 47.6 to 48.3%
There will be some more votes but I doubt there will be a million more.
If I add 4000000 votes for Trump and none for anyone else the Harris popular vote % decreases to 47.1% so it is still over 5% more than the EC%
I am therefore thinking it is clear enough to resolve as over 5%. Does anyone have any objections to that resolution or think we need to wait longer?
@BrunoParga
I will say yes if they are a democratic party member. If they had to cease membership to run as an independent then I would be inclined not to add them.
At the moment I am seeing 47.6% of popular vote for Kamala. There could be adjustments to that or others to add but after excluding Green libertarian and independent Kennedy votes perhaps only 0.2% left between a possibly large number of candidates to sift through but hopefully it won't be that tight to require such work.
On EC votes looking like 226/538 = 42%
So it is looking like over 5% and adding any extra democrat candidates is not going to matter. However larger uncertainty might be are Arizona and Nevada EC votes certain yet?
@ChristopherRandles maybe you'd want to wait for complete certified official results, including the actual electoral college votes, which we won't know for 100% certain until these votes are actually cast in December.
@BrunoParga Yes 12 Nov was optimistic and I may push this back. However hoping not to have to wait until votes actually cast in Dec. My inclination is that if the only risk is a false elector then I should resolve it without waiting. If participants do want to wait to see if there are false electors let me know by commenting.
@ChristopherRandles Is the electoral college percent the popular vote margin in the tipping point state, or the % of votes won by democrats divided by total electoral votes?
@Nightsquared I was presuming it might be the average of the 7 swing states. Definitely needs to be clarified
@ChinmayTheMathGuy @Quinn
Democrat Electoral college % = (Democrat electoral college votes / Total electoral college votes (typically 538)) *100
Total for all states not just tipping point states.
Hope that is clear now
@ChristopherRandles then the most extreme options way underpriced because Dem popular vote is likely between 47% and 53% but the electoral % between 42% and 59%
@ChinmayTheMathGuy I'm happy to bet agaisnt you but I think you are missing a correlation in your analisis
@hidetzugu nah basically it's hard to analyze since most public election models (like 538) have way more uncertainty than I believe is appropriate.
But it's simple, for the over 5% option (I bet up and then sold), that roughly corresponds to 49% popular vote and having less than 44% of EC (236 or fewer), I would say roughly 1 in 5 chance
for the less than -2% option, 2020 Biden would be 51% - 57% which is negative 6%.
Essentially this market's mean is roughly 51% - 53% = -2%, so if Kamala gets at least 290 votes (~40% chance) that will be true
